如何做柱状图和折线图的组合图 怎么做折线图
--世界上只有一种真正的英雄主义,就是看清生活的真相之后依然热爱生活,学习编程成就更好的自己--
Python语言简洁生动,特别适合文科生学习入门IT世界,用几十行代码就能够做一个完整的爬虫脚本,开发效率杠杠的!短时间内即可解决工作和学习中碰到的各种棘手问题 。(本人外语专业毕业,机缘巧合爱上编程,自学道路曲曲折折,痛并快乐!)在这里总结一下自学Python遇到的难点和重点,分享码过的代码和要点总结,希望能够给初学者一点启示和鼓励,同时愿意结交更多大神交流有助提升自己的水平 。
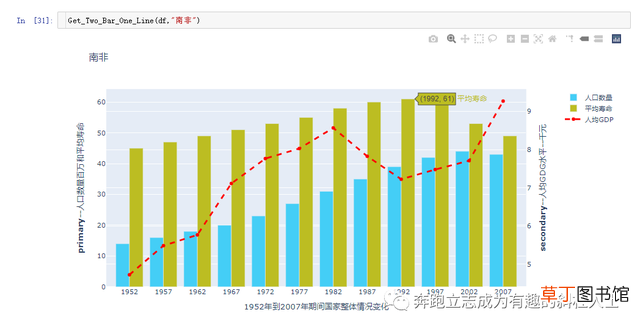
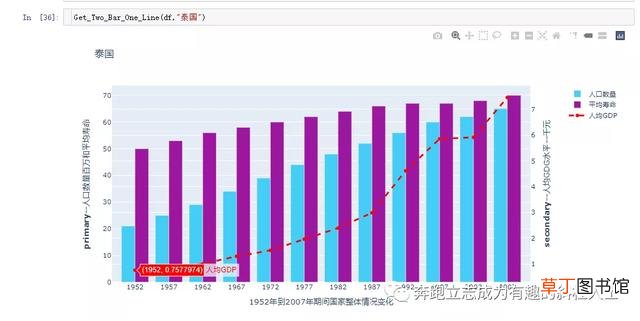
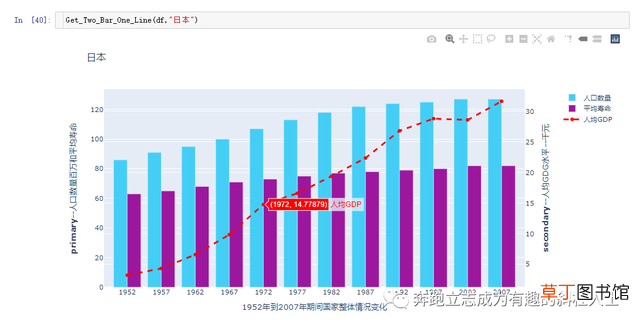
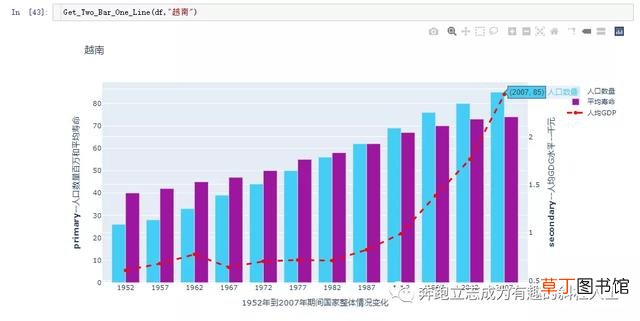
今天分享如何使用Plotly绘制一个比较复杂的图表--柱状和折线双坐标复合图表,即是:柱状图和折线图共同展示,柱状图对应一个坐标轴,折线图对应另一个坐标轴 。另外,可把相关制图过程做成一个自定义制图函数,方便后续直接调用出图,可以大大节省时间,提高工作效率 。下面还以Plotly内置的世界人口数据集合为案例展开讲解:
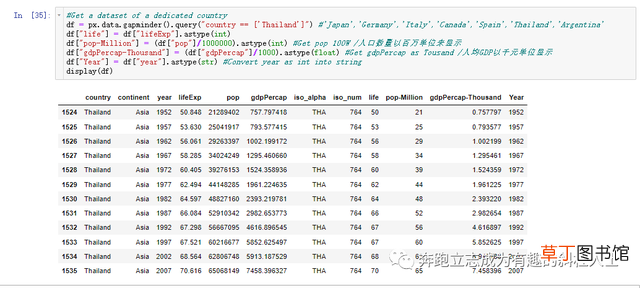
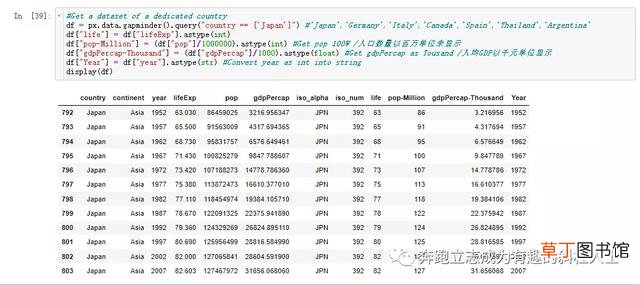
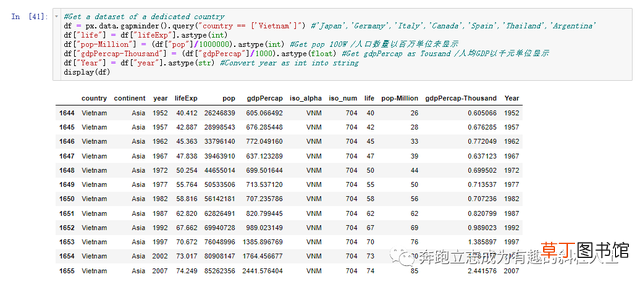
1.调包并抽取一个国家数据,方便后续制图和演示:

文章插图

文章插图

文章插图

文章插图
文章插图
文章插图

文章插图
文章插图
文章插图
文章插图
文章插图
文章插图
文章插图
代码汇总如下:
#import plotly to get the datasetsfrom plotly.subplots import make_subplotsimport plotly.graph_objs as goimport plotly.offline as pyimport plotly_express as px#Get a dataset of a dedicated countrydf = px.data.gapminder().query("country == <'Germany'>") #'Japan','Germany','Italy','Canada','Spain','Thailand','Argentina'df<"life"> = df<"lifeExp">.astype(int)df<"pop-Million"> = (df<"pop">/1000000).astype(int) #Get pop 100W /人口数量以百万单位来显示df<"gdpPercap-Thousand"> = (df<"gdpPercap">/1000).astype(float) #Get gdpPercap as Tousand /人均GDP以千元单位显示df<"Year"> = df<"year">.astype(str) #Convert year as int into stringdisplay(df)display(df.dtypes)#<'#0d0887', '#46039f', '#7201a8', '#9c179e', '#bd3786', '#d8576b', '#ed7953', '#fb9f3a', '#fdca26', '#f0f921'>def Get_Two_Bar_One_Line(X,Y):fig = go.Figure()# Create figure with secondary y-axisfig = make_subplots(specs=<<{"secondary_y": True}>>)# Add tracesfig_bar_one = go.Bar(name="人口数量", x=X<"Year">, y=X<"pop-Million">,marker_color='#44cef6')fig_bar_two = go.Bar(name="平均寿命", x=X<"Year">, y=X<"life">, marker_color='#bcbd22')fig_line_one = go.Scatter(name="人均GDP",x=X<"Year">, y=X<"gdpPercap-Thousand">,line=dict(color='red', width=3, dash='dash'))#define the positionsfig.add_trace(fig_bar_one,secondary_y=False)fig.add_trace(fig_bar_two,secondary_y=False)fig.add_trace(fig_line_one,secondary_y=True)# Add figure titlefig.update_layout(title_text=Y)# Set x-axis titlefig.update_xaxes(title_text="1952年到2007年期间国家整体情况变化")# Set y-axes titlesfig.update_yaxes(title_text="<b>primary</b>--人口数量百万和平均寿命", secondary_y=False)fig.update_yaxes(title_text="<b>secondary</b>--人均GDG水平--千元", secondary_y=True)return fig.show()Get_Two_Bar_One_Line(df,"德国")#Get a dataset of a dedicated countrydf = px.data.gapminder().query("country == <'South Africa'>") #'Japan','Germany','Italy','Canada','Spain','Thailand','Argentina'df<"life"> = df<"lifeExp">.astype(int)df<"pop-Million"> = (df<"pop">/1000000).astype(int) #Get pop 100W /人口数量以百万单位来显示df<"gdpPercap-Thousand"> = (df
- 腊猪尾巴怎样做好吃
- 红豆米饭怎么做
- 河蚌煮粥该怎么做
- ps金属光泽要怎么做
- WPS如何撤销和恢复
- 12345电话是做什么的
- 电脑如何调节亮度 笔记本亮度调节的方法
- 如何制作大枣年糕
- 欢乐斗地主怎么送好友欢乐豆 欢乐斗地主如何送好友欢乐豆
- 明日方舟怎么在电脑上玩 明日方舟如何在电脑上玩